3 Stages of Data Visualization
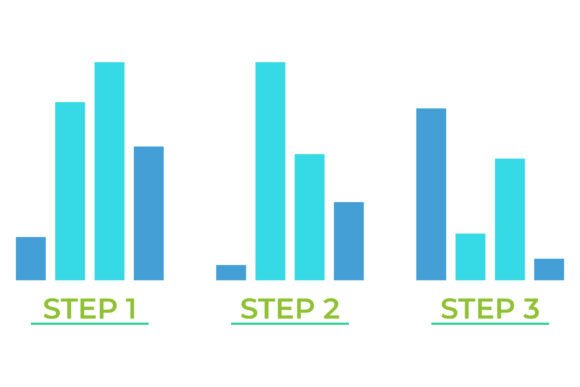
Data visualization is more than just charts and graphs—it’s a structured process that transforms raw numbers into meaningful insights. The 3 Stages of Data Visualization provide a clear framework for understanding how data moves from collection to interpretation, making it easier to communicate complex ideas effectively.
These stages are not just theoretical—they’re practical tools that help professionals in various fields make informed decisions, tell compelling stories, and drive action. Whether you're analyzing sales trends, tracking project progress, or presenting research findings, mastering these stages can elevate your data communication game.
The journey begins with data collection, continues through analysis, and ends with presentation. Each stage plays a critical role in ensuring that the final visual output is both accurate and impactful. Understanding this process helps you avoid common pitfalls and create visuals that resonate with your audience.
Stage 1: Data Collection and Preparation
The first stage of the 3 Stages of Data Visualization involves gathering and preparing data. This isn’t just about collecting numbers—it’s about ensuring the data is relevant, accurate, and ready for analysis. Without proper preparation, even the most elegant visualizations can mislead or confuse.
During this phase, you’ll clean the data, remove inconsistencies, and structure it in a way that makes sense for the next steps. This might involve organizing spreadsheets, eliminating duplicates, or normalizing values. It’s a crucial step that sets the foundation for everything that follows.
For example, a marketing team planning a campaign might collect data on past performance, customer demographics, and competitor activity. By organizing this information into a coherent dataset, they lay the groundwork for meaningful analysis and informed decision-making.
Stage 2: Analysis and Interpretation
Once the data is prepared, the second stage focuses on analysis and interpretation. This is where patterns, trends, and relationships emerge. You begin to ask questions like, “What does this data tell us?” and “How can we use this information?”
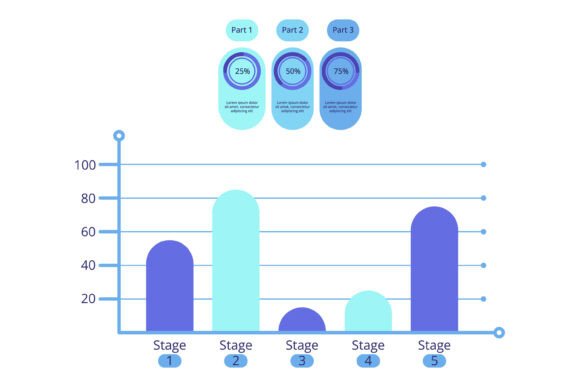
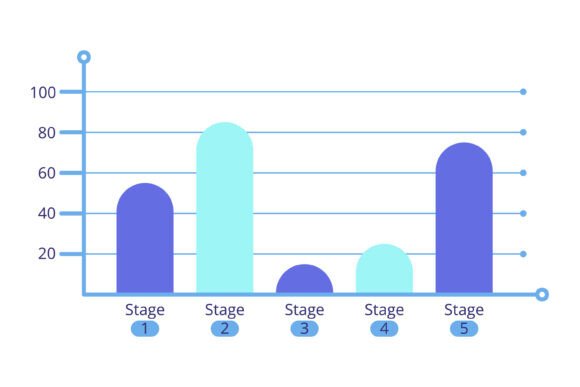
Here, bar graphs, line charts, and other visual tools come into play. These visuals help break down complex datasets into digestible formats. The goal is to uncover insights that might otherwise go unnoticed in a sea of numbers.
Consider a business owner reviewing monthly sales reports. By analyzing the data, they might discover that certain products perform better during specific seasons. This insight can inform inventory decisions, marketing strategies, and even staffing needs.
Stage 3: Presentation and Communication
The final stage of the 3 Stages of Data Visualization is presentation and communication. This is where the insights you’ve uncovered are transformed into visuals that engage and inform your audience. The right design choices can make all the difference between a confusing chart and a compelling story.
This stage requires a balance between aesthetics and clarity. A well-designed infographic, for instance, can convey a wealth of information in a visually appealing way. Sharp bar graphs, consistent color schemes, and intuitive layouts help ensure that the message is clear and memorable.
Imagine an educator using an infographic to explain climate change trends to students. By presenting data in a visually engaging format, they make complex concepts more accessible and easier to understand. This approach not only enhances learning but also encourages critical thinking.
Why the 3 Stages Matter
The 3 Stages of Data Visualization are valuable because they offer a systematic approach to working with data. They help ensure that every step of the process is intentional and purposeful, reducing the risk of errors and misinterpretations.
Professionals in fields like finance, healthcare, education, and technology rely on these stages to make data-driven decisions. For instance, a financial analyst might use the stages to track investment performance, while a healthcare provider could use them to monitor patient outcomes.
Moreover, the stages support collaboration. When teams follow a structured approach, it becomes easier to share insights, align on goals, and work toward common objectives. This is especially important in cross-functional projects where multiple stakeholders are involved.
Key Characteristics of the 3 Stages
The 3 Stages of Data Visualization are defined by their clarity, adaptability, and focus on user experience. Each stage emphasizes precision and relevance, ensuring that the final product meets the needs of its intended audience.
One of the strengths of this framework is its flexibility. It can be applied to small-scale projects, such as personal budgeting, or large-scale initiatives, like corporate reporting. This versatility makes it a powerful tool for anyone working with data.
Another notable quality is its emphasis on storytelling. Data is more than just numbers—it’s a narrative waiting to be told. The 3 Stages guide you through the process of turning raw data into a compelling story that resonates with your audience.
Applications Across Different Fields
The 3 Stages of Data Visualization have practical applications in a wide range of environments. In personal settings, individuals can use them to track fitness goals, manage finances, or plan events. For example, someone monitoring their daily water intake might use a simple bar graph to visualize progress over time.
In professional contexts, the stages are essential for performance tracking, strategic planning, and stakeholder communication. A project manager might use the stages to present team performance metrics, helping to identify areas for improvement and celebrate successes.
Educators can leverage the 3 Stages to teach data literacy and critical thinking. Students might analyze historical trends, compare scientific data, or evaluate social issues. These activities not only enhance learning but also develop analytical skills that are valuable in many careers.
Benefits of Mastering the 3 Stages
Mastering the 3 Stages of Data Visualization offers numerous benefits, including improved usability, efficiency, and engagement. When data is presented clearly, it becomes easier for audiences to understand and act upon.
From a business perspective, effective data visualization can lead to better decision-making, increased productivity, and stronger branding. A well-designed infographic, for instance, can reinforce a company’s identity while delivering valuable insights.
On a personal level, understanding these stages can help individuals make informed choices, whether it’s managing time, tracking health, or exploring new interests. The ability to interpret and present data confidently is a valuable skill in today’s data-driven world.
Practical Considerations
When working with the 3 Stages of Data Visualization, it’s important to consider factors like audience, purpose, and platform. What works for a technical report may not be suitable for a social media post. Tailoring your approach ensures that your message is both relevant and effective.
Additionally, choosing the right tools and software can streamline the process. From spreadsheet programs to advanced visualization platforms, there are many options available depending on your needs and expertise.
Finally, continuous learning and practice are key to mastering the 3 Stages. As data evolves and new tools emerge, staying updated helps you remain proficient and adaptable in your data communication efforts.
By embracing the 3 Stages of Data Visualization, you unlock the power of data to inform, inspire, and influence. Whether you're a professional, student, or hobbyist, this framework provides a roadmap for turning numbers into meaningful insights.