Data Viz Pyramid Stages: A Strategic Approach to Visual Communication
The Data Viz Pyramid Stages model offers a structured framework for understanding and implementing effective data visualization. By breaking down the process into distinct, hierarchical steps, it provides clarity on how to transform raw data into meaningful insights. This approach is particularly valuable in fields where clear communication of complex information is essential, such as business analytics, marketing, education, and research.
Understanding the Data Viz Pyramid Stages
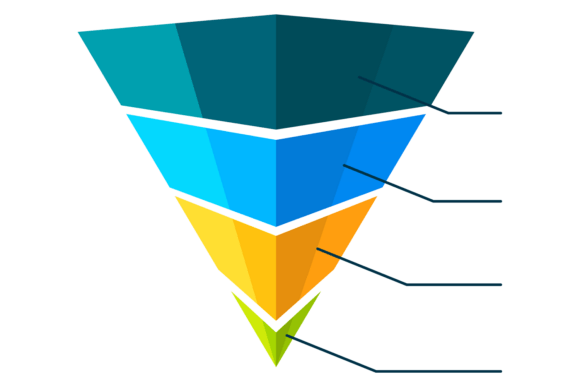
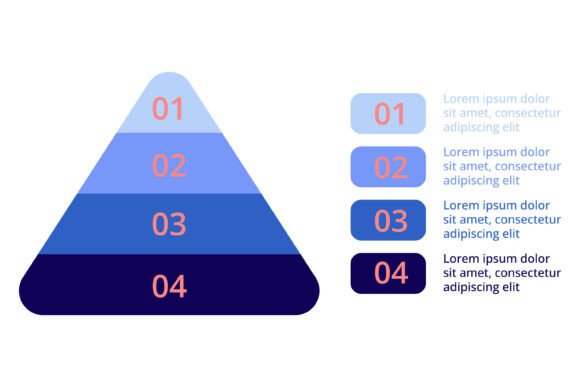
The Data Viz Pyramid Stages is a conceptual model that organizes the data visualization process into four key stages. Each stage builds upon the previous one, ensuring that the final output is both accurate and impactful. The pyramid structure visually reinforces the idea that foundational elements must be solid before moving to more advanced or sophisticated visual representations.
This model emphasizes a logical progression from basic data collection and preparation to the creation of compelling visual narratives. It helps professionals avoid common pitfalls such as overcomplicating visuals or misrepresenting data, which can lead to confusion or misinterpretation.
Stage 1: Data Collection and Preparation
The first stage of the Data Viz Pyramid Stages focuses on gathering and organizing raw data. This step involves identifying relevant data sources, cleaning the data to remove errors or inconsistencies, and structuring it in a way that supports analysis. Without proper preparation, even the most visually appealing charts can fail to convey accurate information.
Effective data collection requires a clear understanding of the goals and audience. For example, a marketer analyzing customer behavior may need different data points than a financial analyst assessing market trends. The quality of this initial stage directly impacts the reliability of subsequent visualizations.
Stage 2: Analysis and Interpretation
Once the data is ready, the next step is to analyze it and derive meaningful insights. This stage involves identifying patterns, trends, and correlations that can inform decision-making. It also includes determining the most appropriate type of visualization for the data, whether it’s a bar chart, line graph, or interactive dashboard.
Interpretation is where the value of data begins to emerge. A well-analyzed dataset can reveal opportunities, challenges, or anomalies that might not be immediately obvious. This stage is crucial for ensuring that the final visualization serves a clear purpose and aligns with the intended message.
Stage 3: Design and Visualization
The third stage of the Data Viz Pyramid Stages is where the actual visual representation takes shape. Here, designers and analysts apply principles of visual hierarchy, color theory, and typography to create engaging and easy-to-understand graphics. The goal is to make complex information accessible without sacrificing accuracy.
Good design goes beyond aesthetics—it enhances usability. For instance, using contrasting colors to highlight key data points or simplifying layouts to reduce cognitive load can significantly improve user engagement. This stage also involves testing the visualization with target audiences to ensure it meets their needs and expectations.
Stage 4: Communication and Feedback
The final stage of the Data Viz Pyramid Stages is about delivering the visualization to the intended audience and gathering feedback. This step ensures that the message is effectively communicated and that any necessary adjustments are made based on user input. It also helps identify areas for improvement in future projects.
Communication is not just about presenting data—it’s about storytelling. A successful visualization should guide the viewer through the data, helping them understand the context, significance, and implications. Feedback loops are essential for refining the process and ensuring long-term relevance.
Key Characteristics of Data Viz Pyramid Stages
The Data Viz Pyramid Stages model is designed to be adaptable and scalable, making it suitable for a wide range of applications. Its strength lies in its ability to provide a consistent framework while allowing flexibility in implementation. This makes it an ideal tool for teams working on diverse projects with varying levels of complexity.
One of the most notable features of the model is its emphasis on clarity and simplicity. By focusing on the essentials first, it reduces the risk of overwhelming the audience with unnecessary details. This approach is especially beneficial in fast-paced environments where quick decisions are often required.
Another advantage is the model’s focus on collaboration. Each stage encourages input from different stakeholders, ensuring that the final visualization reflects a shared understanding of the data and its implications. This collaborative aspect can lead to more accurate and impactful results.
Practical Value and Real-World Applications
The Data Viz Pyramid Stages has proven to be a valuable resource in various industries. In marketing, for example, it helps teams present campaign performance metrics in a way that’s easy to digest and act upon. In education, it supports the creation of visual learning materials that enhance student comprehension.
In the healthcare sector, the model can be used to visualize patient data, treatment outcomes, and research findings. This not only improves internal decision-making but also facilitates better communication with patients and stakeholders. Similarly, in finance, it aids in presenting complex financial reports in a more transparent and understandable manner.
For small businesses and startups, the Data Viz Pyramid Stages offers a structured approach to data-driven planning and strategy. By following the model, entrepreneurs can avoid common mistakes and make informed decisions based on reliable data insights.
Strengths and Limitations
One of the main strengths of the Data Viz Pyramid Stages is its ability to promote consistency across different projects. By following a standardized process, teams can maintain a high level of quality and coherence in their visual outputs. This is particularly useful when multiple people are involved in the creation or review of data visualizations.
However, the model is not without its limitations. In some cases, the rigid structure may feel restrictive, especially for creative or experimental projects that require more flexible approaches. Additionally, the effectiveness of the model depends heavily on the expertise of the individuals implementing it. Without proper training or experience, the process may not yield the desired results.
Despite these challenges, the Data Viz Pyramid Stages remains a powerful tool for anyone looking to improve their data visualization practices. Its emphasis on process, clarity, and collaboration makes it a valuable asset in today’s data-driven world.
Who Benefits Most from Data Viz Pyramid Stages?
The Data Viz Pyramid Stages is particularly beneficial for professionals who work with data on a regular basis. This includes data analysts, marketers, business strategists, educators, and researchers. It is also useful for individuals who want to improve their ability to communicate complex information effectively.
For freelancers and consultants, the model can serve as a reliable framework for delivering high-quality visualizations to clients. It helps ensure that their work meets industry standards and aligns with the client’s objectives. For educators, it provides a clear method for teaching students how to approach data visualization projects systematically.
Small business owners and entrepreneurs can use the model to make data-informed decisions without relying on external experts. By following the stages, they can create visual reports that support strategic planning and performance evaluation.
Final Thoughts
The Data Viz Pyramid Stages offers a practical and organized approach to data visualization that can benefit a wide range of users. Whether you’re a seasoned professional or just starting out, understanding and applying this model can help you create more effective and impactful visual content.
By focusing on the fundamentals first, the model ensures that your visualizations are not only visually appealing but also accurate and meaningful. As data continues to play an increasingly important role in decision-making, mastering the principles of the Data Viz Pyramid Stages can give you a competitive edge in your field.